Eugenie Y. Lai

Contact: eylai [at] mit.edu
GitHub: ey-l
Twitter: @EugenieLai
CV, transcript
News [More Updates]
2021.04 Joining the Data Systems Group (DSG) at MIT EECS CSAIL as a PhD student in Fall '21.
Theme by orderedlist
Data-Driven City Planning: We Made a Visualizer for Surrey’s Electric Vehicle Strategy
Date: 2019-10-29
Last summer, I teamed up with Laura Greenstreet and developed this visualization tool as a part of the UBC Data Science for Social Good (DSSG) program, directed by Dr. Raymond Ng. A collaboration between the UBC Data Science Institute and the City of Surrey, our project opened my eyes on the influential role of data in city planning and sustainability.
Update on 2020-05-30: The city’s Energy and Sustainability Office contacted us to extend our database and visualizer to incorporate some new datasets they just acquired. We’re thrilled to see the city has been using our visualizer and is interested in maintaining it one year on!
Background & Motivation
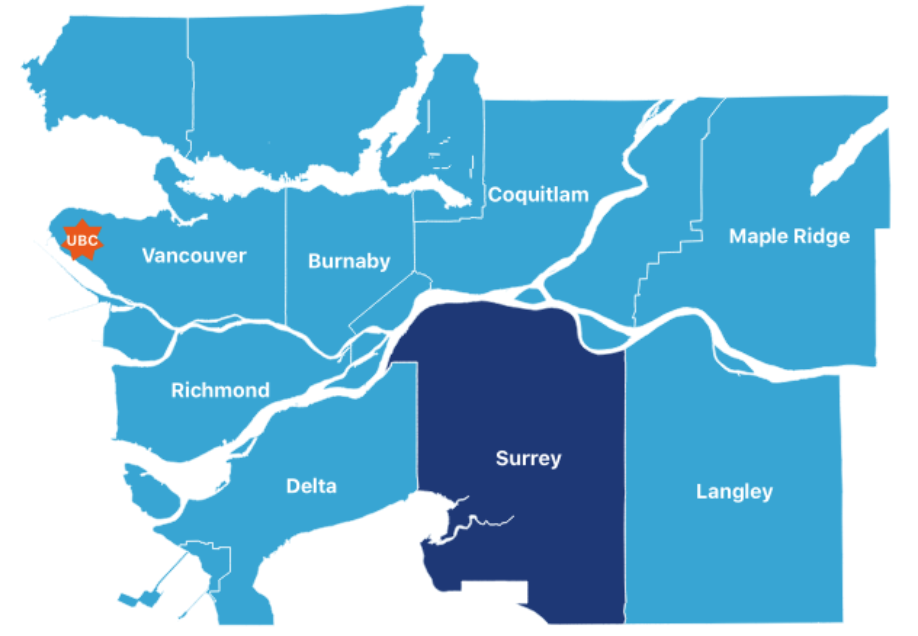
Surrey is the second-largest city in the Metro Vancouver area with around 550,000 residents. By 2050, Surrey is projected to be the biggest city in the Metro Van area with over 800,000 residents. Hence the decisions made by the city of Surrey today will have a big impact as the city grows in the next 30 years.

The city also aims to grow sustainably, with the goal to lower per capita emissions to half of the levels in 2007 by 2040. Transportation will play an important role in this change, as 50% of Surrey’s greenhouse gas emissions come from transportation, compared to only 28% across Canada. Surrey only plans to decrease per-capita driving distance by 9%, resulting in low-emission vehicles playing an important role in reaching the city’s emission goals.
The Problem
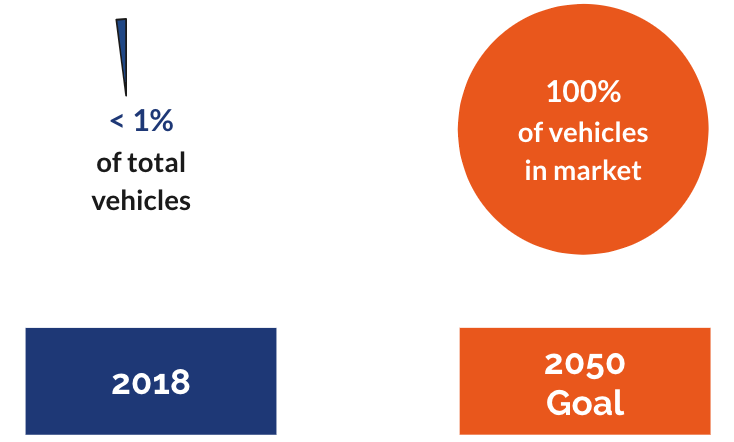
Motivated by these factors, the city of Surrey is currently developing an electric vehicle (EV) transformation strategy to support EV adoption, and the goal is to reach 100% zero-emission vehicles by 2050.

However, there are a number of challenges:
- EV adoption faces a chicken-and-egg problem: People wouldn’t get EVs unless there are chargers, but the private sector wouldn’t build chargers unless there is a market. In addition, it’s unknown to what extent the city should fund EV development until the private sector takes over.
- Adopters are constrained by the high cost of EVs.
- There is a lack of public awareness.

There is also a big gap between the current state and the goal.
- Low EV adoption: From the 2018 ICBC registration dataset, EV only takes up less than 1% of the total passenger vehicles in Surrey.
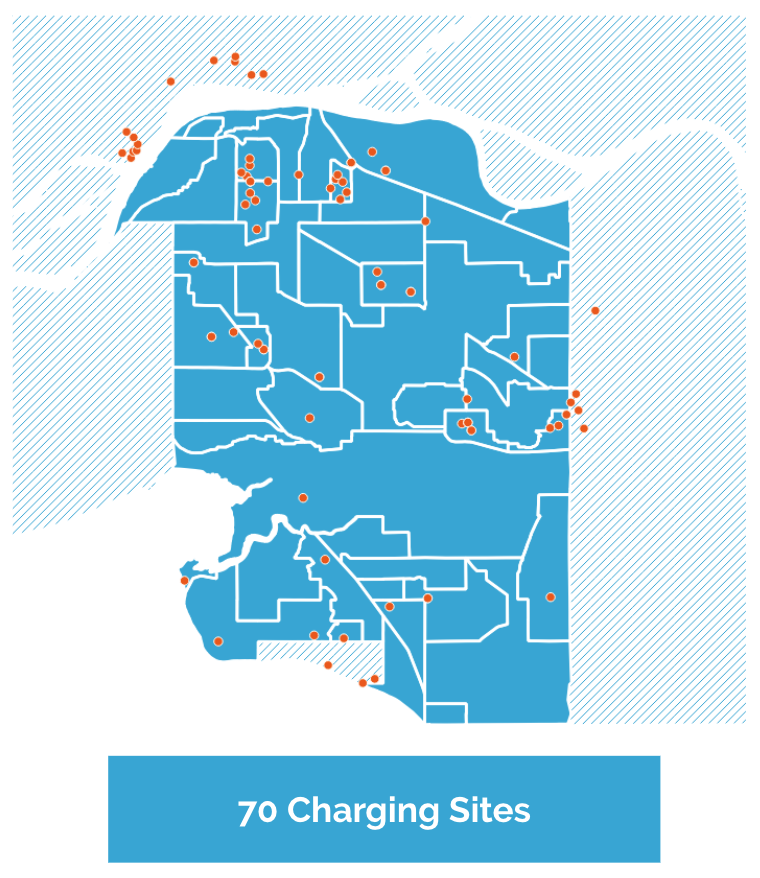
- Inadequate EV infrastructure: There are only 70 public charging sites in and within a 5km radius of Surrey, representing around 180 chargers.

Hence the EV transformation strategy is much needed.
As a part of the transformation strategy, EV infrastructure plays an essential role in promoting EV adoption. However, without adequate tech support, the existing process to determine where to install an EV charging site is solely based on experts’ experience, despite a large volume of data owned by the city.
The purpose of our project is to help Surrey adopt EV faster by providing city planners with statistical evidence to guide the EV infrastructure development. Specifically, our goal is to help the city strategically implement EV charging stations in Surrey.
Our work consists of a database, a visualization tool, and a statistical/ML modelling piece on the datasets. This post focuses on the visualization tool and its impact.
Our Visualizer
Our visualizer aims to help the city planners explore:
- The spatial distribution of Surrey’s vehicle stock, traffic flows, land use, and population demographics.
- The categorical distribution.
- The time trends.

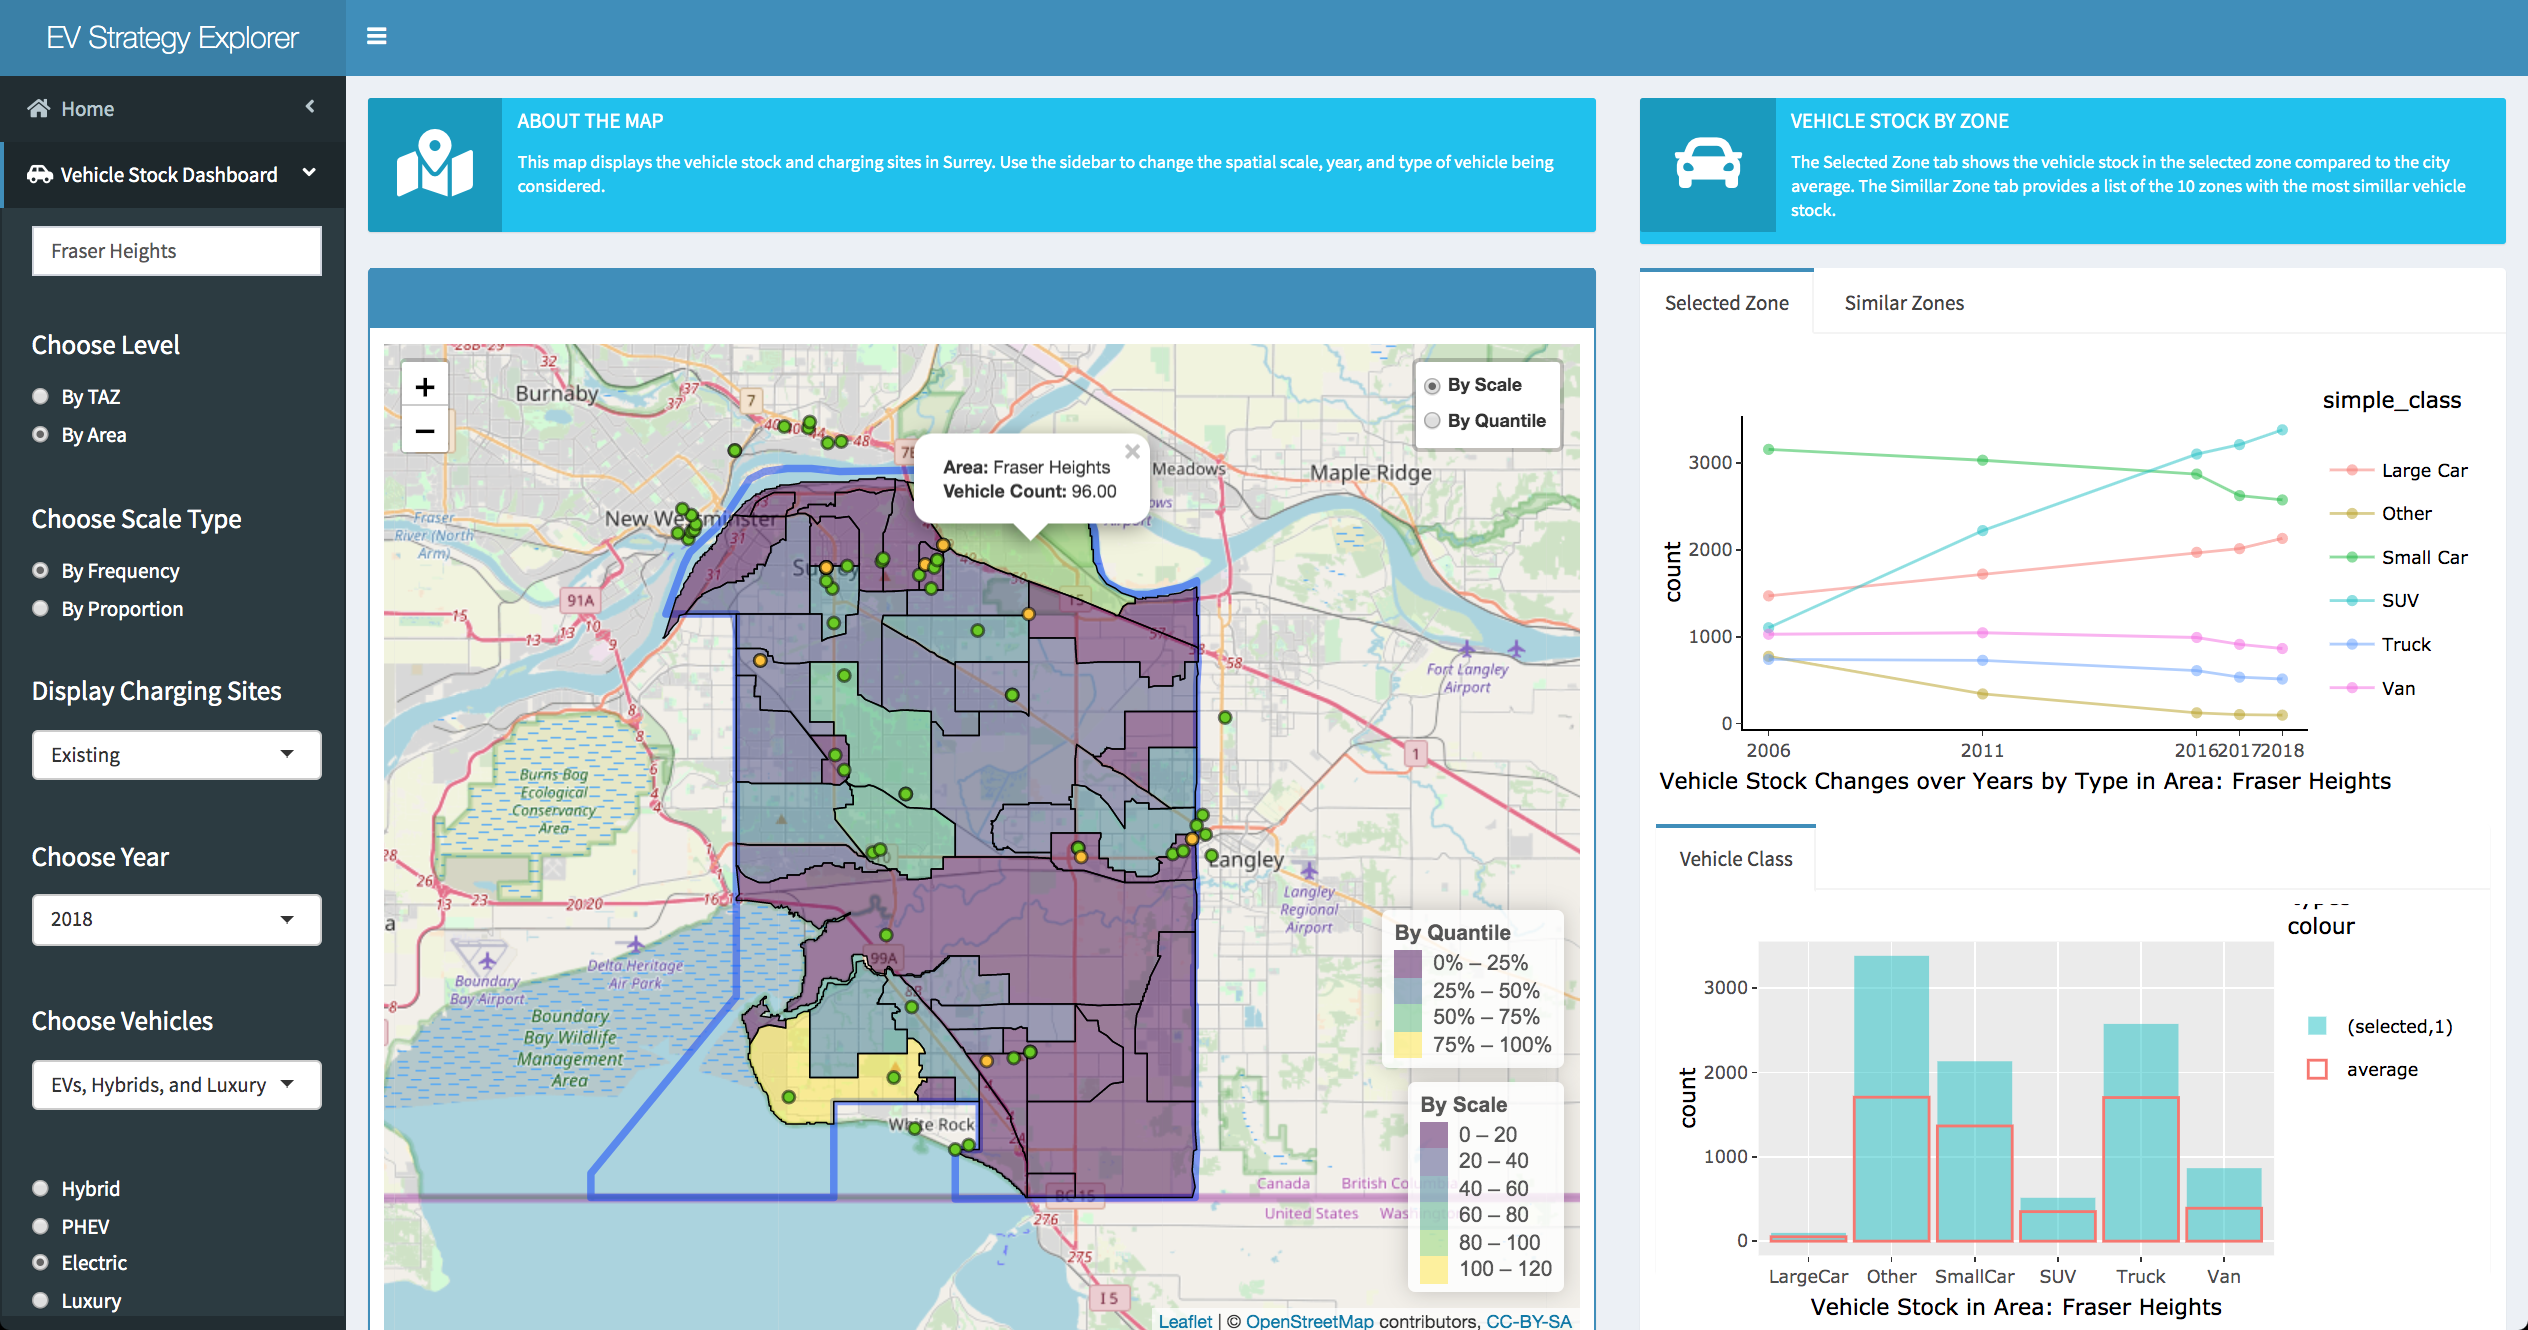
For example, on the vehicle stock tab shown above:
- The map on the left is showing the number of EVs per area in 2018.
- The plots on the right show the statistics specific to a selected area, Fraser Heights:
- The line graph on the top right shows the yearly changes of vehicle counts by class.
- The bar chart on the bottom right shows the vehicle composition compared to the city average.
However, a challenge we see is that maps could be prone to subjectivity. For example, choosing different colour scales for a heat map can minimize or exaggerate the differences in EV density across areas.
To mitigate subjectivity, the visualizer shows data on several metrics to give the user several perspectives. For example:
- On the vehicle stock tab, users are able to see where EVs are located in each area by either count or proportion.
- By count, Cloverdale Industrial doesn’t show up in the top quantile
- By proportion, Cloverdale Industrial becomes an outlier with 4% EVs compared to 2% in the area with the next largest percentage.
In addition, the visualizer allows the user to zoom in and out between the Traffic Analysis Zone (TAZ) and area level for different spatial resolutions.
How the Tool Helps
Now let’s walk you through a simplified process for a city planner to place a new charging site using our visualizer. We consider three criteria to pick a good candidate location:
- The number of EV in the area.
- The mid-day traffic flow to the area.
- The existing charging stations in the area.
Impact
In September 2019, the city used our visualizer to choose 20 sites for curbside chargers for a federal funding proposal. The tool is currently still being maintained by us with funding from the city.
